Covid-19 crisis management maps
The prefecture of the Tarn department worked with a research team from IMT Mines Albi to meet their needs in managing the Covid-19 crisis. Frédérick Benaben, an industrial engineering researcher, explains the tool they developed to help local stakeholders visualize the necessary information and facilitate their decision-making.
“The Covid-19 crisis is original and new, because it is above all an information crisis,” says Frédérick Benaben, a researcher in information system interoperability at IMT Mines Albi. Usually, crisis management involves complex organization to get different stakeholders to work together. This has not been the case in the current health crisis. The difficulty here lies in obtaining information: it is important to know who is sick, where the sick people are and where the resources are. The algorithmic crisis management tools that Frédérick Benaben’s team have been working on are thus incompatible with current needs.
“When we were contacted by the Tarn prefecture to provide them with a crisis management tool, we had to start almost from scratch,” says the researcher. This crisis is not so complex in its management that it requires the help of artificial intelligence, but it is so widespread that it is difficult to display all the information at once. The researchers therefore worked on using a tool that ensures both the demographic visualization of the territory and the optimization of volunteer workers’ routes.
The Tarn team was able to make this tool available quickly and thus save a considerable amount of time for stakeholders in the territory. The success of this project also lies in the cohesion at the territorial level between a research establishment and local stakeholders, reacting quickly and effectively to an unprecedented crisis. The prefecture wanted to work on maps to visualize the needs and resources of the department, and that is what Frédérick Benaben and his colleagues, Aurélie Montarnal, Julien Lesbegueries and Guillaume Martin provided them with.
Visualizing the department
The first requirement was to be able to visualize the needs of the municipalities in the department. It was then necessary to identify the people most at risk of being affected by the disease. Researchers drew on INSEE’s public data to pool information such as age or population density. “The aim was to divide the territory into municipalities and cantons in order to diagnose fragility on a local scale,” explains Frédérick Benaben. For example, there are greater risks for municipalities whose residents are mostly over 65 years of age.
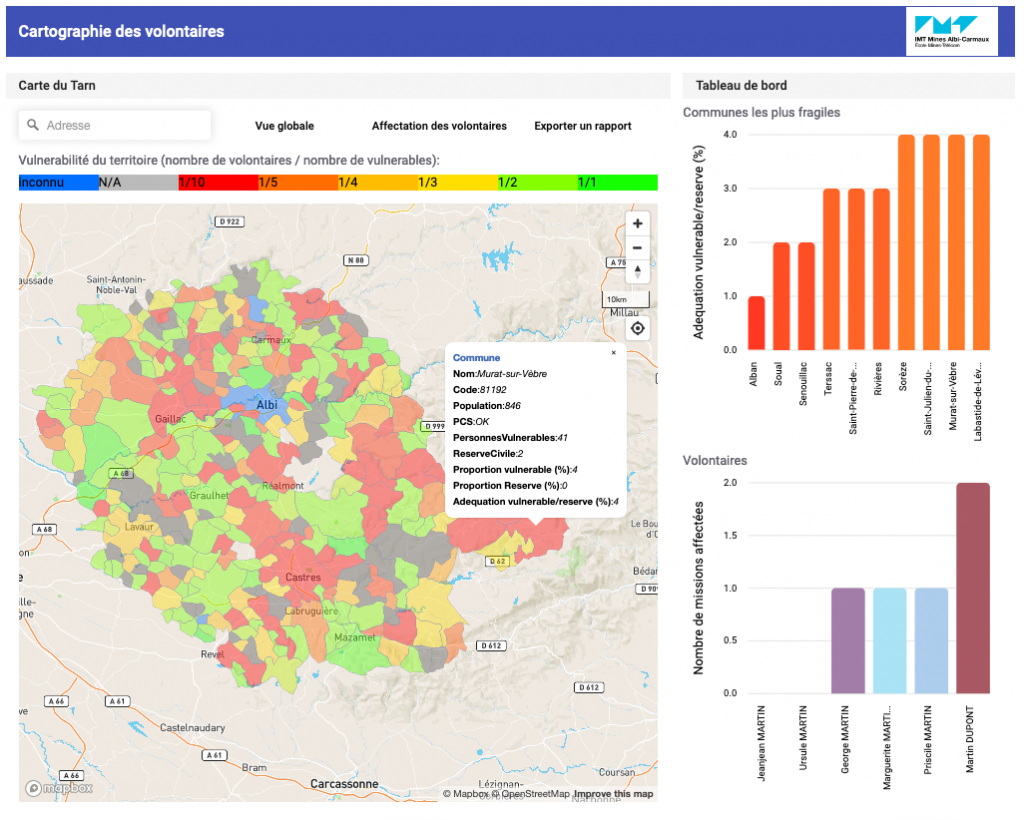
The researchers therefore created a map of the department with several layers that can be activated to visualize the different information. One showing the fragility of the municipalities, another indicating the resilience of the territory – based, for example, on the number of volunteers. By identifying themselves on the prefecture’s website, these people volunteer to go shopping for others, or simply to keep in touch or check on residents. “We can then see the relationship between the number of people at risk and the number of volunteers in a town, to see if the town has sufficient resources to respond,” says the researcher.
Some towns with a lot of volunteers appear mostly in green, those with a lack of volunteers are very red. “This gives us a representation of the Tarn as a sort of paving with red and green tiles, the aim being to create a uniform color by associating the surplus volunteers with those municipalities which need them” specifies Frédérick Benaben.
This territorial visualization tool offers a simple and clear view to local stakeholders to diagnose the needs of their towns. With this information in hand it is easier for them to make decisions to prepare or react. “If a territory is red, we know that the situation will be difficult when the virus hits,” says the researcher. The prefecture can then allocate resources for one of these territories, for example by requisitioning premises if there is no emergency center in the vicinity. It may also include decisions on communication, such as a call for volunteers.
Optimizing routes
This dynamic map is continuously updated with new data, such as the registration of new volunteers. “There is a very contemplative aspect and a more dynamic aspect that optimizes the routes of volunteers,” says Frédérick Benaben. There are many parameters to be taken into account when deciding on routes and this can be a real headache for the employees of the prefecture. Moreover, these volunteer routes must also be designed to limit the spread of the epidemic.
The needs of people who are ill or at risk must be matched with the skills of the volunteers. Some residents ask for help with errands or gardening, but others also need medical care or help with personal hygiene that requires special skills. It is also necessary to take into account the ability of volunteers to travel, whether by vehicle, bicycle or on foot. With regard to Covid-19, it is also essential to limit contact and reduce the perimeter of the routes as much as possible.
“With this information, we can develop an algorithm to optimize each volunteer’s routes,” says the researcher. This is of course personal data to which the researchers do not have access. They have tested the algorithm with fictitious values to ensure functionality when the prefecture enters the real data.
“The interest of this mapping solution lies in the possibilities for development,” says Frédérick Benaben. Depending on the available data, new visualization layers can be added. “Currently we have little or no data on those who are contaminated or at risk of dangerous contamination and remain at home. If we had this data we could add a new layer of visualization and provide additional support for decision making. We can configure as many layers of visualizations as we want.
Tiphaine Claveau for I’MTech


Leave a Reply
Want to join the discussion?Feel free to contribute!