Covid-19: putting the figures into perspective
Since the start of the Covid-19 crisis we have developed a unique relationship with the abundance of figures reflecting the current state of affairs. They are used as indicators to describe the trends in the pandemic and serve to make major political decisions. Valérie Charolles, a researcher in philosophy at Institut Mines-Télécom Business School, explains her reflections on the epistemological issues with this numerical representation of the epidemic.
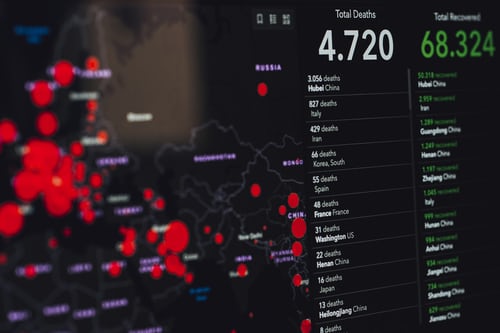
Figures on the number of cases and deaths were available early on in the Covid-19 pandemic and have been used to assess the state of the situation and make important political decisions. “Covid-19 is an emblematic illustration of a new form of world, a world in which political decisions are no longer based on words and things but on facts and figures”, says Valérie Charolles, a researcher in philosophy at Institut Mines-Télécom Business School and a member of the Values and Policies of Personal Information Chair at IMT. “This presents several major challenges at the epistemological, methodological and critical levels.”
The epistemological reflection on this unprecedented situation questions, in particular, the way in which the figures are put together and interpreted. For example, the number of cases detected, the trend in which we have been able to follow over time in different countries across the world, depends on the number of tests available and the testing policy used. There is therefore a sample effect: because more tests are carried out today than during the first wave, the number of confirmed cases has increased due to the influence of this bias. Another sampling bias is caused by asymptomatic cases. People with symptoms are more likely to go for a test than others, but it is possible to be positive for SARS-Cov2 without having any symptoms.
Numbers and bias
The role of epistemology in this situation is to question the way in which knowledge of the epidemic is produced and the representation that emerges from the information created. If the biases lead to a distorted image of reality, we must consider ways to diminish them. The best solution would be to have regular measurements on representative samples of the population which would reflect the proportion of infected people rather than the number of cases detected. “This would make it possible to include asymptomatic cases and remove the effects of variation in testing policies and thus have a much better view of the spread of the epidemic. The United Kingdom has been using this kind of monitoring for several months in partnership with Oxford University”, explains Valérie Charolles.
“As far as the number of deaths is concerned, we must not forget to compare it to the number of deaths in previous years”, says the researcher. Worldwide, about 50 million people die each year, including 600,000 in France. The number of deaths by Covid-19 during the first wave and part of the second corresponds to 10% of the annual number of deaths in France. “In terms of excess mortality due to Covid, a study by INSEE published this summer shows that, for the first wave, the number of deaths remained unchanged for people under 49 and only dramatically increased (+40%) for people over 70. It is not a question of ignoring the danger of this virus, which is very real, but of looking more closely at what the figures tell us and putting them in perspective”, explains Valérie Charolles.
For example, the lockdown reduced the risk factors for sudden deaths (accidents). On the other hand, the saturation of hospital services affected the treatment of other life-threatening illnesses. Since Covid-19 has a more serious effect on the elderly, there is also a bias caused by the fact that some people would have died anyway from other causes. According to the researcher, all these factors should be taken into consideration when representing the reality of the epidemic, because they provide a more detailed perspective than the number of cases and deaths.
Even the choice of indicators is a point of interest. Other facts and figures could have been relayed better over time, such as those on the progress in the availability of hydroalcoholic gel and masks, treatments and patient care. These elements were less visible than the statistics on deaths and the number of cases detected. “We could have presented a different story, another version: that of the rapid progress we have made in protection, detecting the virus, treatment and now in the availability of vaccines,” says the researcher. “Not only to have a more relaxed society, but also to better explain what was happening.”
The aim of this analysis is not to undermine through criticism, but to adopt a perspective of reconstruction. Reflection on the issues at stake in this crisis starts with understanding the data presented to us. “Representing figures is a profession in its own right. Today, a large number of people are not trained to understand figures. Giving the population the ability to observe and understand what is said is an essential project for supporting democracy”, concludes Valérie Charolles.
Valérie Charolles’s latest book, “Libéralisme contre capitalisme”, was published by folio on January 14, 2020. More information on the folio website.


Leave a Reply
Want to join the discussion?Feel free to contribute!